
Ethereum Technical Analysis 2026
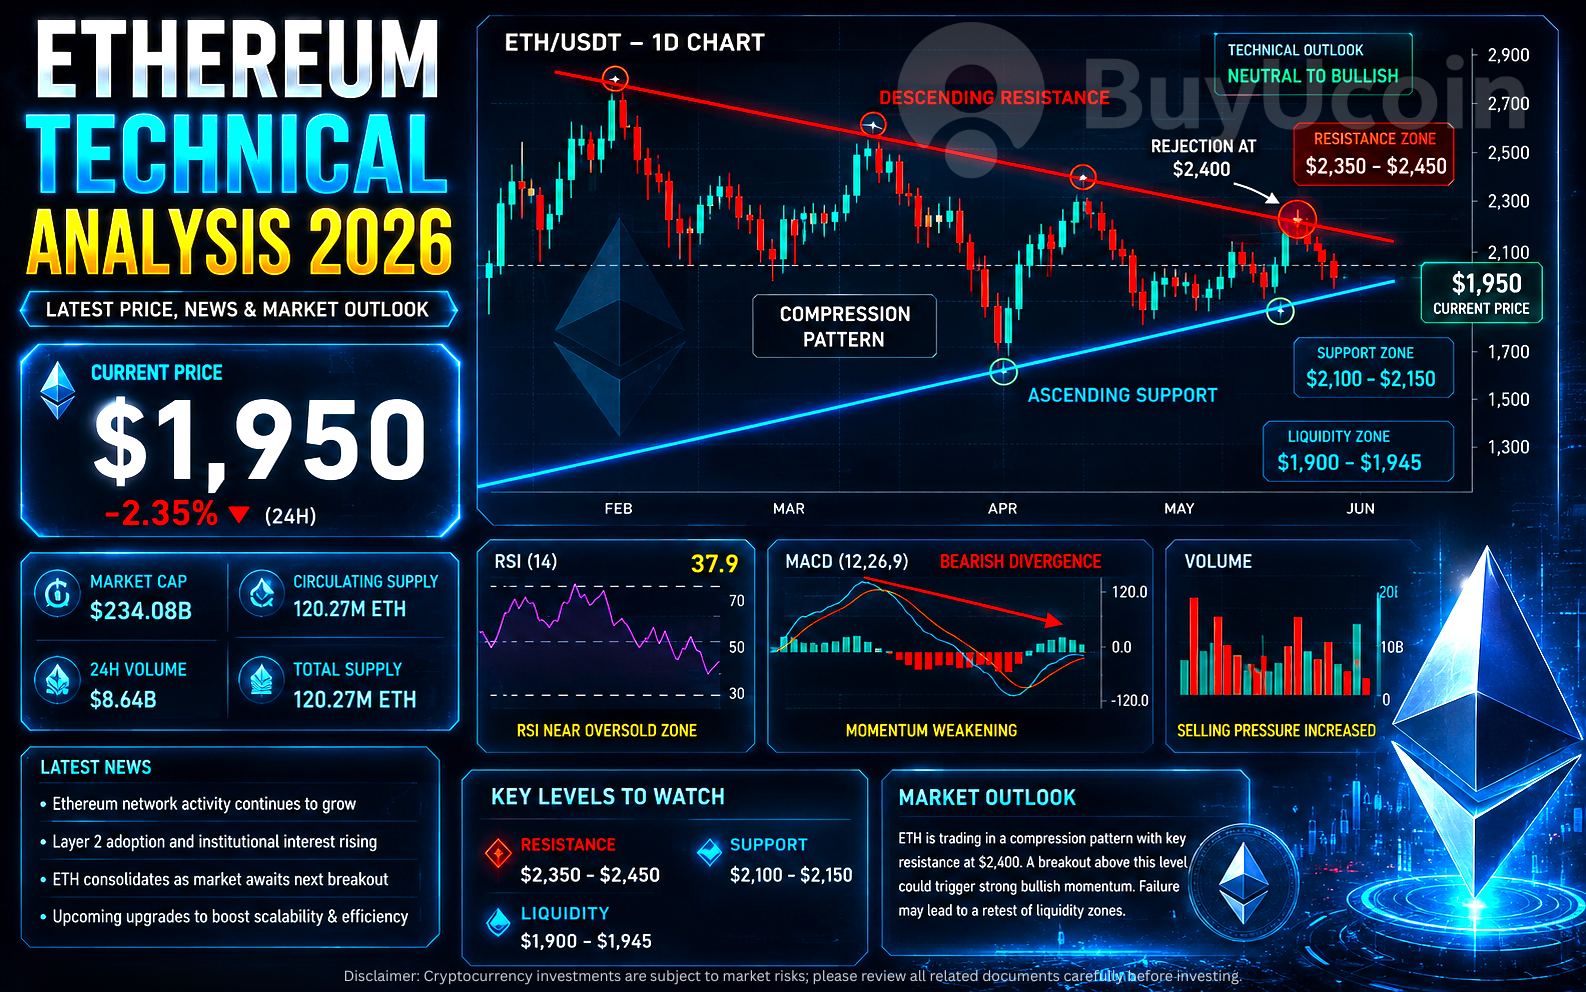
Ethereum is currently trading around $2,000 and facing significant resistance pressure after failing to break above the $2,350-$2,400 zone. The ETH technical analysis reveals a market trapped between rising support near $2,140-$2,200 and descending resistance, creating a compression structure that typically precedes volatile breakout moves.
This Ethereum technical analysis examines the current market structure, weakening momentum, liquidity zones, and trapped investor psychology that are shaping ETH's near-term outlook.
Quick Summary Of This Analysis
Current Market Condition: ETH trading around $2,000 near liquidity hunting zone of $1940-$1950
Resistance Pressure: Strong selling pressure defending the $2,380-$2,387 zone with multiple failed breakout attempts
Liquidity Zone Discussion: Significant buy-side liquidity exists near $1940-$1950, attracting potential volatility
Trapped Investor Psychology: Buyers who entered expecting breakout continuation are now trapped above the current price, increasing selling pressure
Technical Outlook: Neutral-to-bearish short-term with medium-term bullish structure still intact higher lows hold
Volatility Expectations: May is historically Ethereum's most volatile month; extreme price fluctuations expected near liquidity zones
Market Data Tables
Current Ethereum Market Statistics
Metric | Value |
ETH/USD Price | ~$2,000 |
~₹1,91,000 | |
Market Cap | ~$240 billion |
Circulating Supply | 120.69 million ETH |
24h Trading Volume | ~$18.05 billion |
24h Price Change | -0.71% |
Market Rank | #2 by market cap |
Key Technical Levels
Level Type | Price Zone |
Immediate Support (S1) | ~$1,970-$1,980 |
Strong Support (S2) | ~$1,930-$1945 |
Deep Support (S3) | ~$1,800 |
Pivot Point | ~$2,070 |
Immediate Resistance (R1) | ~$2,000 |
Key Resistance (R2) | ~$2,141 |
Strong Resistance (R3) | ~$2385 |
Market Sentiment Indicators
Indicator | Current Value | Signal |
RSI (14) | 34.1-37.9 | Neutral |
MACD | Below the signal line | Bearish momentum |
20-day EMA | $2,287 | Price below EMA |
Funding Rates | Negative | Bearish sentiment |
Market Sentiment | Neutral-to-bearish | Cautious |
Ethereum Latest News
Recent market developments are influencing Ethereum's price action. U.S. inflation data showing 3.5% has pressured risk assets, including ETH, creating bearish sentiment across cryptocurrency markets. Negative taker buy-sell ratios and funding rates indicate market participants are reducing exposure to Ethereum.
Technical analysts note that Ethereum recently rejected a key liquidity zone on the 1-hour chart, sweeping the "EXP HIGH" area before reversing sharply. This pattern forms lower highs—a common bearish structure that often precedes deeper retracements.
Historical data shows that May is typically one of Ethereum's most volatile months, and current market conditions could exacerbate investment risks. The combination of macroeconomic uncertainty, weak derivative metrics, and technical resistance has created a challenging environment for ETH bulls.
For a broader market context, investors interested in alternative opportunities may want to review our guide on the Top 10 Cryptos to Buy in 2026, which examines emerging projects with strong fundamentals beyond Ethereum.
Technical Analysis
Market Structure: Higher Lows Remain Intact
Ethereum's daily timeframe shows a crucial structural pattern: the market continues to respect a broader ascending support trendline that has been developing since February lows near $1,780. This trendline is the backbone of Ethereum's medium-term bullish structure.
The key observation is that higher lows are still being maintained on the daily chart. This means that despite short-term price weakness, the long-term uptrend remains technically intact. However, ETH is also trading beneath a short-term descending resistance trendline, creating a compression structure.
This compression—where price is trapped between rising support and descending resistance—typically indicates that the market is building pressure for its next major directional move.
Weakening Momentum After Repeated Rejections
The chart reveals that ETH attempted multiple pushes toward the ~$2,400 resistance area, but sellers consistently defended the upper descending trendline. The highlighted rejection zone near $2,386 suggests strong selling pressure from institutional traders at that level.
Following the rejection, Ethereum experienced a gradual decline toward the rising trendline support near $2,040. This pullback represents a corrective phase rather than a full bearish reversal, as there is no aggressive panic selling visible in the volume data.
Momentum indicators confirm this weakening: The RSI reading of 34.1-37.9 places Ethereum in neutral territory, suggesting neither overbought nor oversold conditions. However, the MACD line is below the signal line, indicating bearish momentum with potential downward pressure continuing.
Resistance Rejection Mechanics
The $2,380-$2,400 resistance zone has become a formidable barrier for Ethereum bulls.
This resistance is significant for several reasons:
Previous breakout attempts failed: Multiple tries to break above this zone resulted in sharp reversals
Institutional selling pressure: Large desks defend this level, likely due to trapped positions from previous rallies
Technical confluence: The resistance aligns with the descending trendline and moving average resistance
For context on how resistance zones work and why they matter, understanding broader market dynamics like those in our article on Bitcoin Is Building Quiet Bullish Momentum Could BTC Hit A New All Time High provides a valuable perspective on how major cryptocurrencies interact with key technical levels.
Liquidity Analysis
What Are Liquidity Zones and Why They Matter
Liquidity zones are price areas where significant stop-loss orders, limit orders, and institutional positions are concentrated. These zones act as magnets for price movement because market makers and large institutions often push prices toward these areas to fill large orders efficiently.
Current analysis shows Ethereum's path of least resistance may continue downward toward significant liquidity pockets unless the $2,100-$2,140 resistance is reclaimed.
Downside Liquidity Targets
The Volatix Range Map indicator—introduced earlier in 2026—identifies potential high and low-price zones derived from daily volatility patterns.
According to this model:
Psychological support at ~$2,000: This level attracts significant liquidity as it's a major round number
Deeper liquidity pocket around ~$1,945: This zone contains substantial sell-side liquidity that could trigger accelerated downside if breached
Critical support zone $1900-$1,950: Breaching this could accelerate downward momentum.
Liquidity Hunting Behaviour
Recent price action shows Ethereum executed a classic liquidity sweep pattern: the price swept the "EXP HIGH" liquidity area on the 1-hour chart before reversing sharply. This behaviour is characteristic of institutional desks manipulating prices to trigger stop losses before reversing direction.
The pattern shows:
Price rotated out of balance after hitting the upper liquidity band
A sequence of lower highs formed, indicating bearish structure
The downside magnet toward the EXP LOW zones became apparent
Trapped Investor Psychology
Why Trapped Investors Matter
Trapped investors are traders who entered positions expecting a breakout continuation but found themselves on the wrong side when the price reversed. In Ethereum's case, buyers who entered above $2,350-$2,400 expecting breakout continuation are now trapped.
These trapped investors create ongoing selling pressure because:
They become reluctant sellers: When the price approaches their entry point, they're eager to exit at breakeven rather than risk further losses
Their stop-losses create liquidity: As price declines, trapped investors' stop-loss orders trigger, accelerating downward momentum
They reduce buying pressure: Trapped traders are unlikely to buy more until they've exited their losing positions
How Panic Selling Starts
Panic selling typically begins when the price approaches a critical support level that, if breached, would trigger a cascade of stop-loss orders. For Ethereum, the ~$2,000 ascending support trendline is this critical level.
The psychological process unfolds as follows:
Initial weakness: Price struggles to hold above support, creating doubt among holders
First break: When support breaks, early stop-losses trigger, creating downward momentum
Acceleration: As the price falls further, more traders panic and sell at market prices
Oversold bounce: Eventually, buyers step in at oversold levels, creating a temporary bounce
Emotional Trading Creates Risk
Trapped investor psychology demonstrates why emotional trading creates significant risk in cryptocurrency markets. Traders who entered at the wrong time (near resistance) are now making decisions based on fear rather than rational analysis.
Key psychological traps include:
Holding losing positions too long: Hoping the price will return to breakeven
Panic selling at support: Selling exactly when accumulation opportunities appear
Chasing breakouts: Buying at resistance after FOMO kicks in
Understanding investor psychology is crucial for avoiding these traps. For beginners looking to enter the market safely, our guide on Top 10 Best Crypto Under ₹100 in India 2026 provides lower-risk entry points for those still building confidence.
Market Structure
The Compression Pattern
Ethereum is currently in a compression structure—a technical pattern where price consolidates between converging trendlines.
This pattern is significant because:
Volatility is compressing: Price ranges tighten, indicating building energy for the next move
Direction is uncertain: Both bulls and bears are active, creating equilibrium
Breakout is imminent: Compression patterns typically resolve with high-momentum moves
Buyer vs. Seller Pressure
Current market dynamics show:
Factor | Bulls | Bears |
Support Defense | Actively defending $2,050-$2,180 | — |
Resistance Attack | Failed multiple breakout attempts | Successfully defending $2,380-$2,400 |
Volume Behavior | Moderate, no accumulation spike | No aggressive panic selling |
Momentum | Losing short-term strength | MACD below signal line |
The balance currently favours cautious bears in the short term, but the medium-term structure remains cautiously bullish due to higher lows.
Support & Resistance Zones
Support Zones Detailed
Primary Support: $1,980-$2,000
This is the ascending trendline support holding the bullish structure
A confirmed breakdown below this zone would significantly weaken Ethereum's structure
Price is currently consolidating near this level while attempting to stabilize
Secondary Support: $1,900
Major round number attracting significant liquidity
Acts as a psychological barrier for retail traders
Breakdown could trigger accelerated selling toward $1,940
Deep Support: $1,800-$1,825
$1,940: Deep liquidity pocket identified by Volatix model
$1,909: Fibonacci-based support level
$1,741: February low extension, potential bottom zone
Resistance Zones Detailed
Primary Resistance: $2,000-$2,020
Strong selling pressure is defending this zone
Multiple failed breakout attempts created trapped investors
A clean break above this zone was needed to shift momentum decisively
Secondary Resistance: $2,140-$2,200
Immediate resistance cluster above the primary zone
A breakout here would signal bullish continuation
Target: $2,500 psychological level
Extended Resistance: $2,380-$2,400
Uncharted territory above the current range
Would require significant volume and momentum
Potential target if bullish breakout confirms
Volume Analysis
Current Volume Behaviour
Volume during Ethereum's current pullback phase is relatively moderate.
This is a crucial observation because:
No aggressive panic selling: The decline appears corrective rather than a full bearish reversal
Healthy consolidation: Moderate volume suggests traders are waiting for directional clarity
Breakout confirmation needed: A strong move above resistance requires increased volume to be trustworthy
The 24-hour trading volume of $18.05 billion indicates active market participation, but not the extreme volume that would signal a major trend reversal.
What Volume Tells Us
For a bullish breakout to be confirmed, Ethereum needs:
Volume spike above $20 billion on breakout candle
Sustained volume above average for 3-5 candles following breakout
Volume confirmation on retests of broken resistance (now support)
For a bearish breakdown, warning signs include:
Volume increasing on candles
Low volume on bounces (indicating weak buying interest)
Volume spike on breakdown below $1,940 liquidity zone.
Risk Management
Why Risk Management Matters
Cryptocurrency markets are highly volatile, and Ethereum exemplifies this with its tendency for extreme price fluctuations, especially during volatile months like May. Proper risk management is not optional—it's essential for long-term survival in crypto markets.
Key risk management principles:
Never invest more than you can afford to lose: Crypto has no regulatory recourse for losses
Use position sizing: Limit any single position to 1-5% of total portfolio
Set stop-losses: Protect against catastrophic losses by defining maximum acceptable loss
Avoid leverage unless experienced: Leverage amplifies both gains and losses
Why Investors Should Avoid Emotional Decisions
Emotional trading is the #1 cause of losses in cryptocurrency markets. The trapped investor psychology section demonstrated how fear and greed create destructive patterns.
Common emotional traps:
FOMO buying at resistance: Buying after the price has already surged
Panic selling at support: Selling exactly when accumulation opportunities appear
Revenge trading: Trying to immediately recover losses with larger positions
Holding losing positions too long: Hoping the price returns to breakeven
Solution: Create a trading plan before entering any position and stick to it regardless of emotions.
Why Support Confirmation Matters
Many traders make the mistake of buying at support without confirmation.
True support confirmation requires:
Price bouncing with volume: The bounce should have increasing volume
Multiple touches holding: Support should hold at least 2-3 tests
Momentum divergence: RSI showing bullish divergence at support
Candlestick reversal patterns: Hammer, bullish engulfing, or morning star patterns
Buying at support without confirmation is gambling, not investing.
Why Volatility Increases Near Liquidity Zones
Liquidity zones attract institutional activity because large orders need deep liquidity to fill efficiently.
This creates:
Accelerated price movement: Institutions push price toward liquidity pockets
Stop-loss cascades: Trailing stop-losses trigger en masse, amplifying moves
False breakouts: Price may briefly break levels to trigger liquidity before reversing
Near Ethereum's $1900-$1,940 liquidity zone, expect extreme volatility with potential 10-15% moves in hours.
Investor Perspective
Short-Term vs. Medium-Term Outlook
Short-Term (1-2 weeks): Neutral-to-Bearish
ETH is trapped between support and resistance
Bearish MACD momentum continuing
Downside risk toward $2,000-$1,940 if support breaks
Medium-Term (1-3 months): Cautiously Bullish
Higher lows remain intact on the daily timeframe
Ascending trendline still holding support
Bullish if $2,350-$2,400 breaks with volume
What Smart Investors Are Doing
Based on the current market structure, prudent investors are:
Waiting for confirmation: Not buying until support holds or resistance breaks
Building positions gradually: Dollar-cost averaging near support zones
Keeping cash reserves: Maintaining dry powder for better opportunities
Focusing on risk-reward: Only entering when the risk-reward ratio is at least 1:3
When to Consider Entry
For bullish entry, wait for one of these confirmations:
Breakout above $2,350-$2,400 with volume above $20 billion
Bounce from $2,050-$2,100 with bullish candlestick patterns
RSI divergence at support with momentum turning upward
For conservative investors, waiting for the $2,150-$2,200 zone to hold provides additional safety.
Broader Crypto Market Context
Ethereum's current technical situation doesn't exist in isolation—it's part of the broader cryptocurrency market dynamic. The 3.5% U.S. inflation rate and macroeconomic uncertainties are pressuring all risk assets, including Bitcoin and altcoins.
Bitcoin's recent behavior is particularly relevant. As the market leader, BTC's ability to maintain support influences Ethereum's technical structure. Our analysis on Bitcoin Is Building Quiet Bullish Momentum Could BTC Hit A New All Time High examines how Bitcoin's consolidation pattern may set the stage for broader market moves.
The key takeaway: Ethereum's technical setup must be evaluated within the broader market context, not in isolation.
FAQs
1. What is Ethereum's current technical outlook for May 2026?
Ethereum's technical outlook is neutral-to-bearish short-term but cautiously bullish medium-term. ETH is trading at near ~$2,000, trapped between support at $2,050-$2,100 and resistance at $2,350-$2,400. The daily structure favors bullish continuation if higher lows remain intact, but short-term momentum is weakening.
2. What are Ethereum's key support zones to watch?
Ethereum's key support zones are:
Primary: $2,050-$2,100 (ascending trendline)
Secondary: $2,000 (psychological)
Deep: $1,800-$1,825 (liquidity pocket and Fibonacci levels)
A breakdown below $1,750-$1,740 would significantly weaken Ethereum's structure.
3. Why is liquidity pressure important for ETH price?
Liquidity pressure matters because significant liquidity zones act as magnets for price movement. Ethereum's downside liquidity targets at $2,000-$1,940 attract institutional activity and can trigger accelerated moves when breached. Volatility increases dramatically near these zones.
4. Who are trapped investors, and how do they affect Ethereum?
Trapped investors are traders who bought near resistance ($2,350-$2,400) expecting a breakout continuation but are now holding losing positions. They create ongoing selling pressure because they're eager to exit at breakeven when the price approaches their entry, and their stop losses add downward momentum when the price falls.
5. How volatile will Ethereum be in May 2026?
May is historically Ethereum's most volatile month in 2026, and current conditions suggest extreme price fluctuations. The combination of compression structure, macroeconomic uncertainty, and liquidity zones near the current price could trigger 10-15% moves within hours.
6. What is Ethereum's market outlook for the next 1-3 months?
The medium-term outlook is cautiously bullish if the ascending support trendline holds. A confirmed breakout above $2,350-$2,400 with increased volume could reopen bullish momentum toward $2,500-$2,800. However, a breakdown below $2,000 would weaken the structure significantly and target $1,741.
Start Your Crypto Journey Safely with BuyUcoin
Understanding Ethereum's technical structure is just the beginning of your cryptocurrency education. At BuyUcoin, India's trusted crypto exchange, we empower investors with the tools, knowledge, and secure infrastructure needed to navigate digital assets confidently.
Ready to explore cryptocurrency safely?
Download the BuyUcoin App for secure mobile trading
Sign up today to create your account in minutes
Buy Ethereum with instant INR deposits and competitive fees
BuyUcoin serves 1 million+ registered users with industry-leading security, 24/7 support, and educational resources designed for investors at every level.
Get Started with BuyUcoin Now →
Disclaimer: This article is for educational and informational purposes only and does not constitute financial advice, investment advice, trading advice, or any other type of advice. The views, thoughts, and opinions expressed in this article belong solely to the author (Deepak Verma, crypto analyst, BuyUcoin)