
Bitcoin (BTC) has attracted several institutional investors in the past few months, but with the market capitalization sustaining above $700 billion, many more institutions are likely to contemplate buying Bitcoin. Similarly, Ether (ETH) with a market cap of about $180 billion also cannot be ignored by the investors.
The institutional adoption of the top two cryptocurrencies is likely to attract numerous venture capitalists and early investors into smaller projects that have gained a decent size but have not yet reached their full potential. Although the risk is high in such investments, the returns could be equally attractive.

For such investors, there are multiple projects to choose from because over 50 digital assets command a market cap of over $1 billion, giving them unicorn status, a term used in legacy markets for companies with a market cap of over $1 billion.
If large players jump into these unicorns, they are likely to rally strongly, which will benefit the early retail investors who have a head start over the institutions. While these gains may take a long time, traders can benefit in the short term from the sharp up-moves in several altcoins.
Let’s study the charts of the top-5 cryptocurrencies that may resume their uptrend in the next few days.
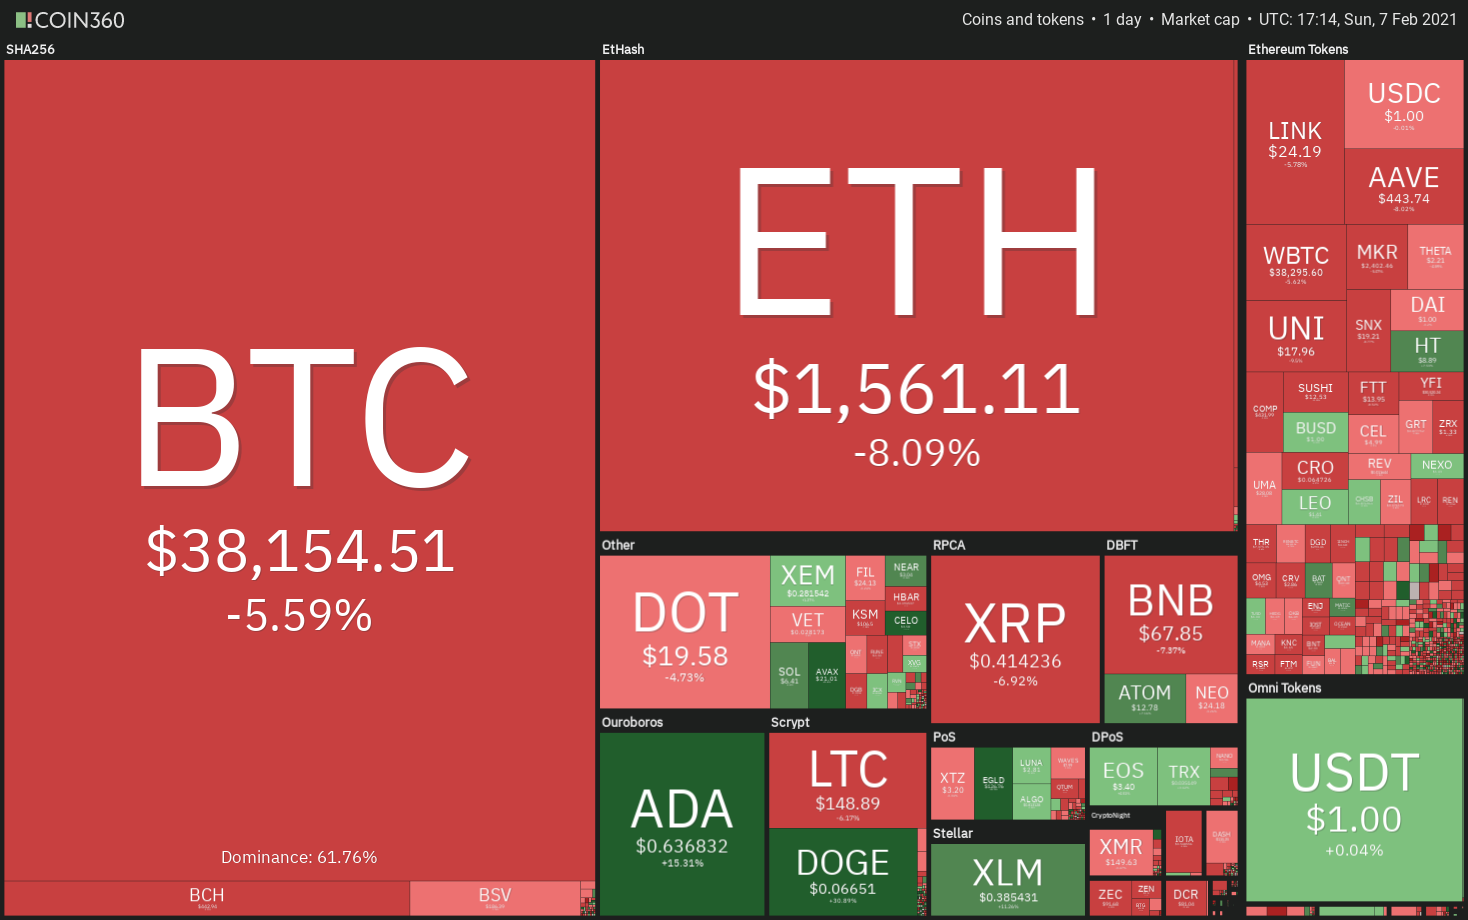
BTC/USD
Bitcoin broke above the $38,000 overhead resistance on Feb. 5 and followed it up with another up-move on Feb. 6, but the bulls could not sustain the higher levels as seen from the long wick on the day’s candlestick.

The failure of the bulls to sustain the price above $40,000 has attracted profit-booking today and the bears are attempting to pull and sustain the price below $38,000. If they succeed, the BTC/USD pair could drop to the 20-day exponential moving average ($35,386).
If the pair rebounds off the 20-day EMA, the bulls will once again try to resume the uptrend. A breakout of the $40,000 to $41,959.63 overhead resistance zone could signal the start of the next leg of the uptrend to $50,000.
On the contrary, if the bears sink the price below the 20-day EMA, the pair may dip to the 50-day simple moving average ($32,840). If this support also cracks, the pair may drop to the $28,850 support.

The 4-hour chart shows the bulls had pushed the price above the $38,000 to $40,000 overhead resistance zone, but the pair turned down from $40,952.16. This shows the bears are active at higher levels.
The pair has dipped below the 20-EMA and the relative strength index (RSI) is just above the midpoint, which suggests the momentum may be weakening. The pair could now drop to the 50-SMA.
If the pair rebounds off the 50-SMA, the bulls will make one more attempt to resume the uptrend, but if the 50-SMA cracks, the correction could deepen to $32,000.
DOT/USD
Polkadot (DOT) is in a strong uptrend. The bulls pushed the price above the $19.40 resistance on Feb. 03 but they have not been able to build upon the breakout. This suggests the bears are attempting to stall the uptrend.

However, the positive sign is that the bulls have not allowed the price to sustain below $19.40. This suggests traders are not booking profits aggressively and are buying on every minor dip.
If the bulls can now propel the price above $21.7321, the next leg of the uptrend could begin. The target objective on the upside is $24.08 and then $30. The rising moving averages and the RSI above 61 suggest the bulls are in control.
Contrary to this assumption, if the bears sink and sustain the price below the 20-day EMA ($17.43), it will suggest that the bullish momentum has weakened. The DOT/USD pair could then spend some more time oscillating between $19.40 and $14.7259.

The 4-hour chart shows the formation of a symmetrical triangle, which generally acts as a continuation pattern. The bears attempted to sink the price below the triangle but the sharp rebound off the 50-SMA shows aggressive buying at lower levels.
If the bulls can propel the price above the triangle, it will shift the advantage in favor of the bulls. The pattern target of the break above the triangle is $24.1621. On the other hand, if the bears sustain the price below the triangle, the pair could drop to $15.8379.
LINK/USD
Chainlink (LINK) broke and closed above the $25.7824 overhead resistance on Feb. 5 but the bulls could not sustain the momentum the next day. This shows the bears are aggressively defending the $25.7824 to $27 resistance zone.

However, the long tail on today’s candlestick shows the bulls are buying the dip to the 20-day EMA ($22.83). The upsloping moving averages and the RSI in the positive zone suggest the path of least resistance is to the upside.
If the bulls can drive the price above the overhead resistance zone, the next leg of the uptrend could begin. The next level to watch on the upside is $30 and if that is also crossed, the up-move may reach $33.
On the contrary, if the bears sink the price below the 20-day EMA, the LINK/USD pair may extend its range-bound action between $20.1111 and $25.7824 for a few more days.

The 4-hour chart shows the formation of an ascending triangle pattern. If the pair rebounds off the current level, the bulls will make one more attempt to push the price above the overhead resistance zone. If they succeed, the pair could rally to the pattern target of $31.4537.
Conversely, if the bears sustain the price below the support line, the pair could drop to $22.61 and then to $21.65. The marginally downsloping 20-EMA and the RSI in the negative territory suggest a minor advantage to the bears.
XLM/USD
The tight range trading between $0.325 and $0.35 resolved to the upside on Feb. 6, which shows the bulls have overpowered the bears. If the bulls can now sustain Stellar Lumens (XLM) above $0.40, the next leg of the uptrend could begin.

The upsloping moving averages and the RSI near the overbought zone suggest that bulls are in command. Above $0.40, the XLM/USD pair could rally to $0.50 where the bears may again mount stiff resistance.
If the bulls fail to close the price above $0.40, the pair could again dip back to $0.35. A strong rebound from this support will suggest the bulls have flipped it to support, which will increase the possibility of a break above $0.40.
Contrary to this assumption, if the bears sink the price below the 20-day EMA ($0.315), it will suggest the current breakout was a bear trap.

The 4-hour chart shows the pair has broken out of a symmetrical triangle, which has a target objective at $0.445. Both moving averages are sloping up and the RSI is in the positive zone, suggesting the bulls are in control.
If the price rebounds off the 20-EMA, it will indicate traders are accumulating on dips and that will enhance the prospects of the resumption of the uptrend. Conversely, a break below the 20-EMA will be the first sign that the momentum may be weakening.
THETA/USD
THETA is currently consolidating in an uptrend. The price action of the past few days has formed a bullish ascending triangle pattern that will complete on a breakout and close above $2.51.

The bulls had pushed the price above $2.51 on Feb. 5 but they could not sustain the breakout. This suggests the bears are trying to defend the resistance at $2.51.
However, the positive sign is that the bulls have not allowed the price to dip below the 20-day EMA ($2.09). If the price rebounds off the current levels, the bulls will again try to thrust the THETA/USD pair above $2.51.
If they succeed, the pair could resume the next leg of the uptrend. The pattern target of the breakout from the triangle is $3.56. This bullish setup will invalidate if the bears sink the price below the triangle.

The 20-EMA on the 4-hour chart has started to turn down and the RSI has dropped into the negative territory, indicating the bears are attempting to make a comeback. A break below $2.10 could pull the price down to the support line of the triangle.
On the other hand, if the price turns up from the current levels or the support line of the triangle, it will suggest the bulls are buying on dips. They will then again try to push the price above the $2.51 resistance.
The views and opinions expressed here are solely those of the author and do not necessarily reflect the views of Cointelegraph. Every investment and trading move involves risk, you should conduct your own research when making a decision.