

Ethereum recovered above the $380 and $385 resistance levels against the US Dollar. ETH price is struggling to clear the $400 resistance, but it is holding the key 100 SMA (H4).
- ETH price is trading well above the $360 and $375 resistance levels against the US Dollar.
- The price traded to a new weekly high at $395 and it is above the 100 simple moving average (4-hours).
- There is a key bullish trend line forming with support near $374 on the 4-hours chart of ETH/USD (data feed via Kraken).
- The pair is likely to continue higher above $400 as long as it is above the 100 SMA (H4).
Ethereum Price Holding Uptrend Support
This past week, Ethereum remained in a positive zone above the $360 resistance against the US Dollar. ETH price even managed to surpass the $380 resistance zone to move further into a positive zone.
Ether price traded to a new weekly high at $395 and it is now well above the 100 simple moving average (4-hours). The price is currently correcting lower and trading below the $385 level. There was a break below the 23.6% Fib retracement level of the upward move from the $353 low to $395 high.
On the downside, the first major support is near the $376 level and the 100 simple moving average (4-hours). There is also a key bullish trend line forming with support near $374 on the 4-hours chart of ETH/USD.
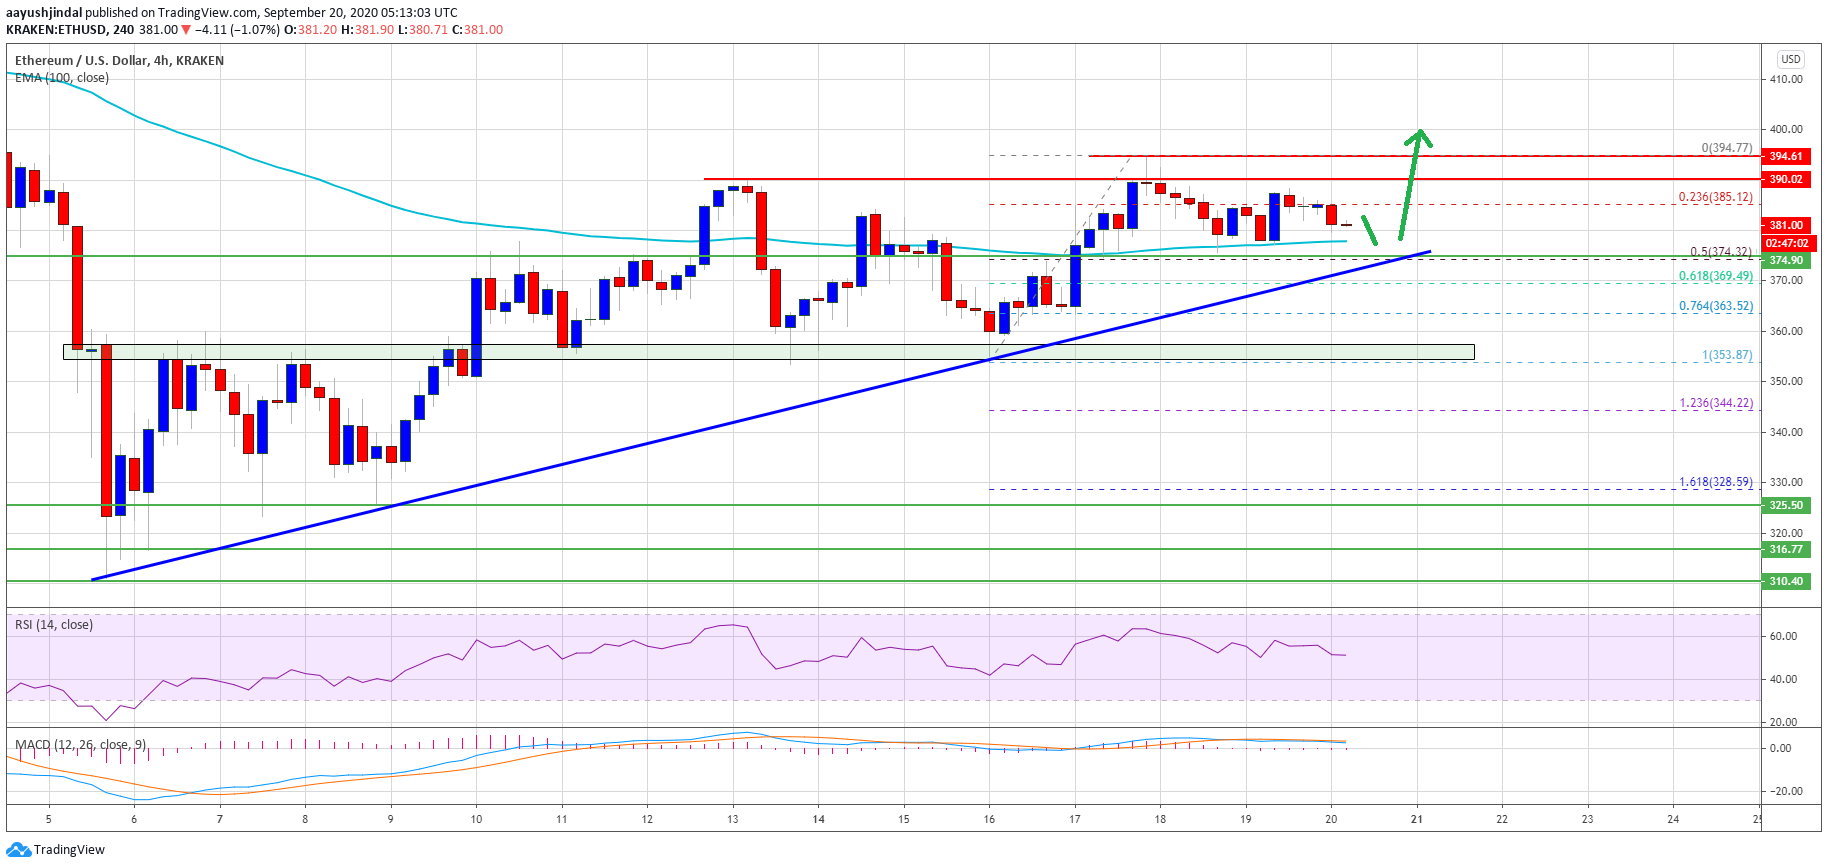
Ethereum price trades above $380. Source: TradingView.com
The trend line support coincides with the 50% Fib retracement level of the upward move from the $353 low to $395 high. On the upside, the price is facing hurdles near the $395 and $400 levels. A successful close above the $400 resistance zone is needed for a fresh rally towards the $420 level or $425.
Downsides Supported in Ether (ETH)?
If Ethereum fails to clear the $400 resistance zone, it might continue to move down. An initial support is near the $375 zone or the 100 simple moving average (4-hours).
If there is a downside break below the trend line support and the 100 SMA, there is a risk of a larger decline towards the $355 and $350 support levels in the near term.
Technical Indicators
4 hours MACD – The MACD for ETH/USD is losing pace in the bullish zone.
4 hours RSI – The RSI for ETH/USD is still above the 50 level.
Major Support Level – $375
Major Resistance Level – $400