

Ethereum started a steady decline from the $395 swing high against the US Dollar. ETH price is now trading just above the main $360 support and the 100 SMA (H4).
- ETH price is showing a few bearish signs below $375 and $380 against the US Dollar.
- The price is still holding the $365 support and the 100 simple moving average (4-hours).
- There is a major declining channel forming with resistance near $372 on the 4-hours chart of ETH/USD (data feed via Kraken).
- The pair is likely to rally above $375 as long as it is trading above the 100 SMA (H4).
Ethereum Price is Facing Hurdles
After forming a major top near the $395 level, Ethereum started a steady decline against the US Dollar. ETH price broke the $380 and $375 support levels to move into a short-term bearish zone.
Ether price tested the $360 level and it remained well bid above the 100 simple moving average (4-hours). A low is formed near $360 and the price is currently correcting higher. It is testing the $368 resistance level. The stated resistance is close to the 23.6% Fib retracement level of the key decline from the $395 high to $360 low.
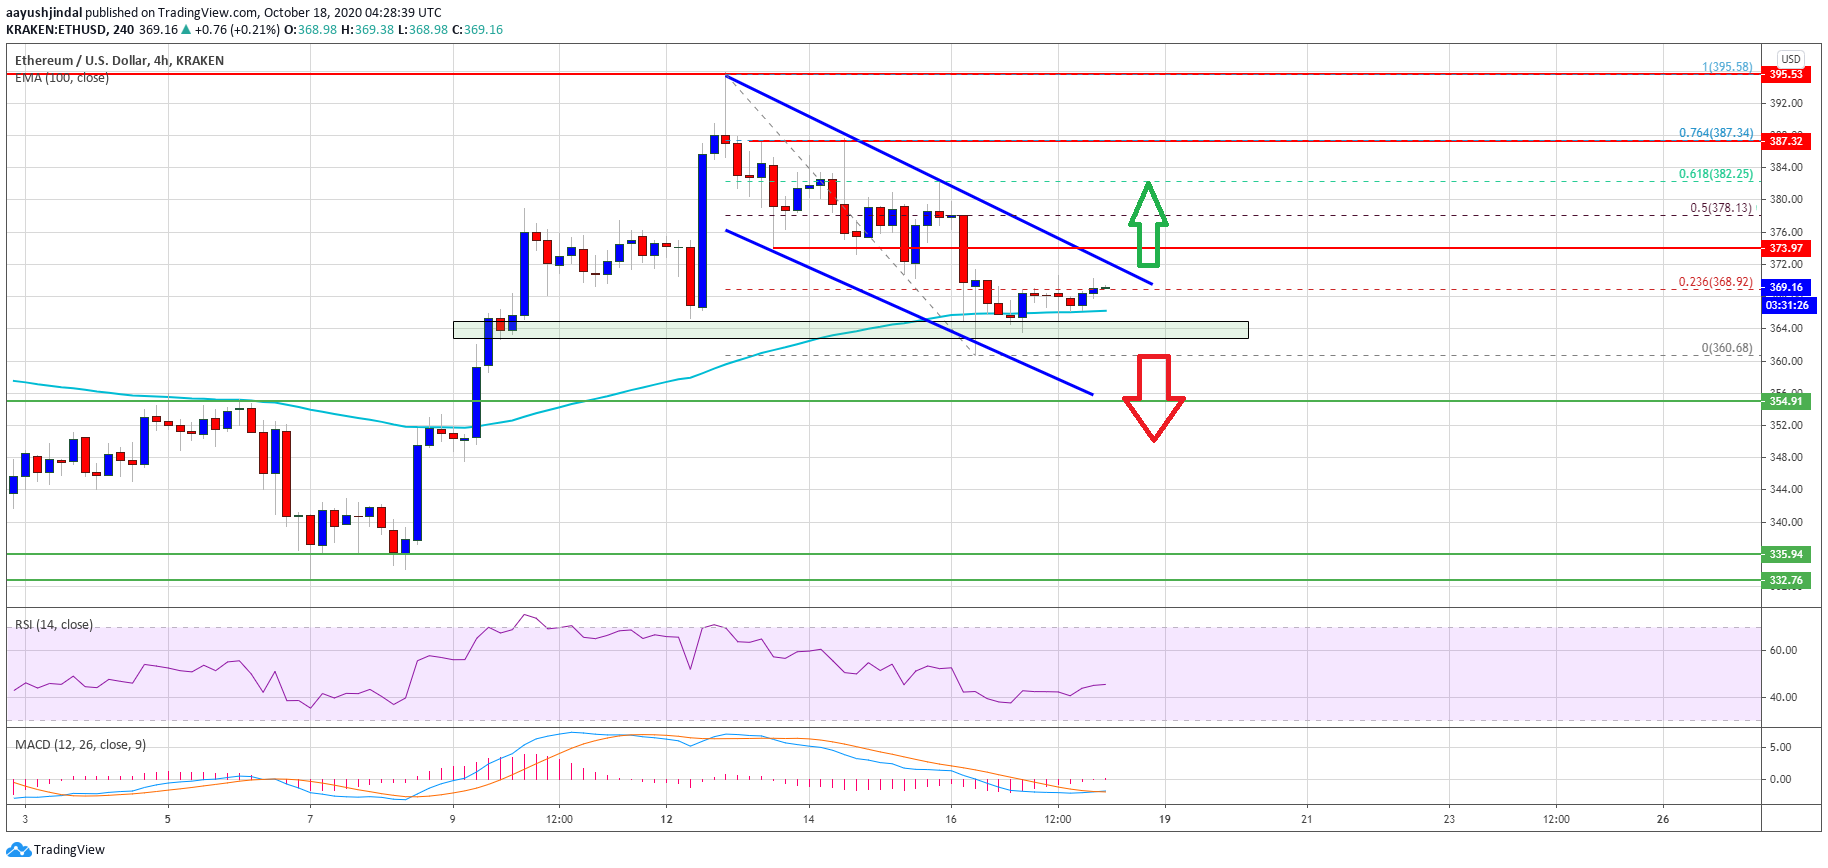
More importantly, there is a major declining channel forming with resistance near $372 on the 4-hours chart of ETH/USD. Above the channel resistance, the bulls might face hurdles near the $375 level.
The next major resistance is near the $378 level or the 50% Fib retracement level of the key decline from the $395 high to $360 low. A clear break above the channel resistance and then a follow up move above the $378 level could open the doors for a fresh increase. The next stop for the bulls could be near the $395 and $400 resistance levels.
Downside Break in Ether (ETH)?
If Ethereum fails to clear the $372 and $375 resistance levels, it might continue to move down. The 100 simple moving average (4-hours) at $366 holds a lot of importance.
A proper close below the 100 SMA (H4), followed by a break below the $365 support zone could spark a sharp decline. The next major support on the downside is near the $355 level.
Technical Indicators
4 hours MACD – The MACD for ETH/USD is slowly moving back into the bullish zone.
4 hours RSI – The RSI for ETH/USD is now just below the 50 level.
Major Support Level – $365
Major Resistance Level – $375